From fundamentals to advanced models in univariate and multivariate time series analysis
Overview
Interactive Analysis
Overview
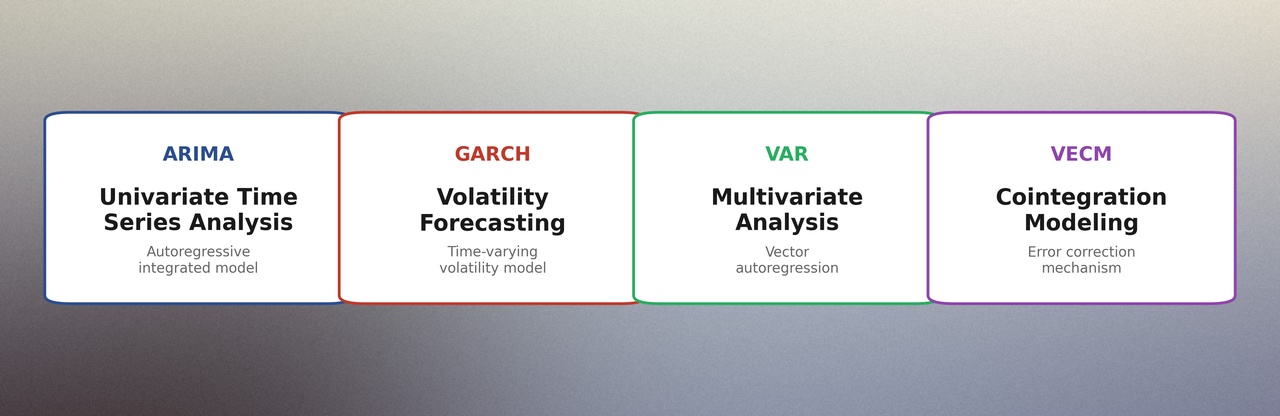
Section 1 covers the fundamentals to advanced models in financial time series data analysis. From univariate time series analysis (ARIMA, GARCH) to multivariate time series analysis (VAR, VECM), we implement models applicable to real financial data using Python.
Main Chapters
Chapter 1: Fundamentals of Time Series Data Analysis
Time series decomposition (Trend, Seasonality, Residual)
Stationary vs non-stationary data
Basic visualization techniques
Chapter 2: Advanced Time Series Analysis
ADF test (Augmented Dickey-Fuller Test) - Stationarity testing
AR, MA models
ACF/PACF plot interpretation
Chapter 3: Univariate Time Series Analysis
ARIMA models
Auto-ARIMA
Model selection (AIC vs BIC)
Chapter 4: Advanced Volatility Modeling and Forecasting
ARCH models
GARCH models
ARIMA-GARCH hybrid models
Chapter 5: Multivariate Time Series Analysis and Advanced Models
VAR models (Vector Autoregression)
Granger Causality
VARMA models
Chapter 6: Advanced Multivariate Time Series Analysis
VECM models (Vector Error Correction Model)
Johansen cointegration test
VAR IRF (Impulse Response Function) and FEVD (Forecast Error Variance Decomposition)
Key Concepts
Stationarity
A fundamental assumption in time series analysis. A time series where the mean and variance do not change over time is called a stationary time series. Most time series models assume stationarity.
Cointegration
When a linear combination of multiple non-stationary time series becomes a stationary time series, these time series are said to be in a cointegration relationship. This is a core concept of the VECM model.
Volatility Clustering
A phenomenon observed in financial time series where high volatility tends to follow high volatility, and low volatility tends to follow low volatility. This is modeled using GARCH models.
Learning Resources
Open Source Code
View the complete implementation code on GitHub. Provides example code and simulation code for each chapter.
Learn the theoretical background and detailed implementation process step by step. Covers from mathematical background of each model to Python implementation.
Run Section1 analysis scripts directly in your browser. Select a chapter and script, configure parameters, and view results with charts and statistics.
Parameters:
Running...
Results
Execution Time: seconds
Error:
Get in touch
If you have any questions or suggestions about the project, please feel free to contact us.